| Applicable packages | X Not available under the Single Lite tier |
This article is for event organizers. If you are an event participant, please see our Resources for Participants section.Under the last page on your events management dashboard, you are able to track analytics for your event in real-time. Here, you can see the different metrics which will be tracked, though if you customized your submission form and removed some of the default fields or modified them significantly then some of the metrics/charts may not be applicable. With this, you can monitor activity and engagement over the course of your event. This feature is included in the Single Plus, Single Premium, and all subscription packages.
You can click and drag your cursor along the y-axis of any graph in order to zoom into a highlighted portion.
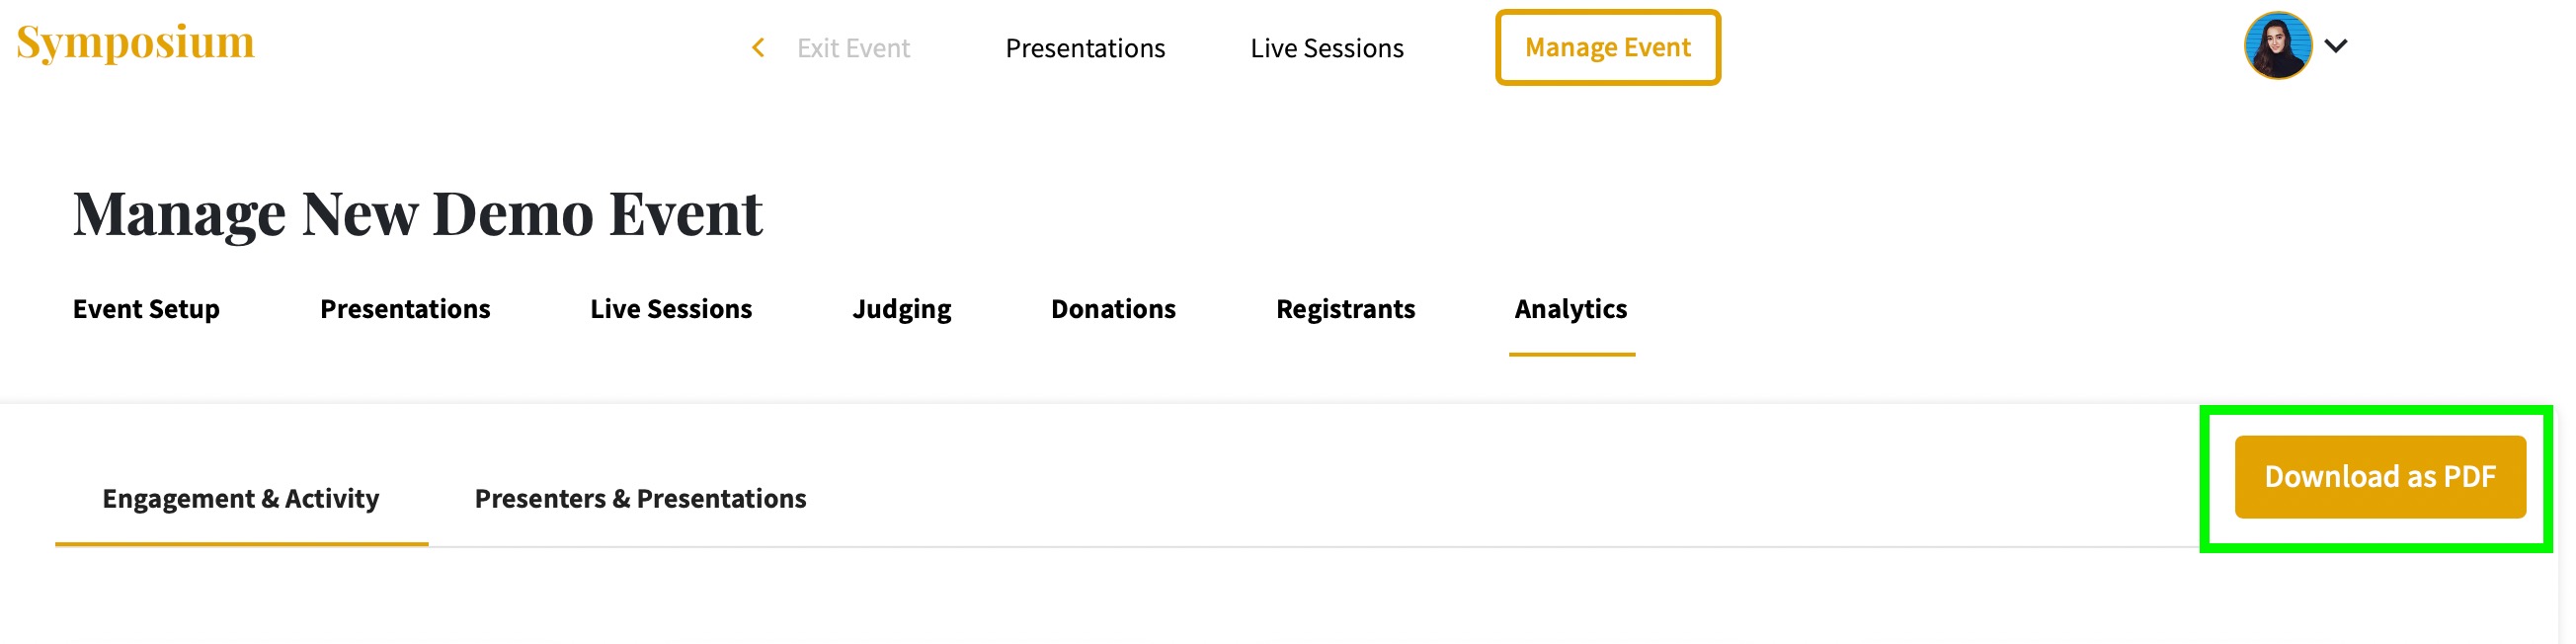
You can export a PDF report of all of the summarized data available on your Analytics dashboard via the yellow Export button in the top right hand corner under your Analytics tab. You may do this at any point during or after your event, for as long as your event is active on the Symposium website (per the uptime associated with your package).
NOTE: Once your event has expired, you will no longer have access to your event management dashboard, and therefore will lose access to the event Analytics. We will, however, automatically email your analytics report to you 14 days after your event launch in case you forgot to download it.
Below, please find a list of available metrics and their definitions:
- Total visits to your event: the total number of visitor sessions to your event, including both public viewers and registrants (depending on your event access settings). If a participant returns to your event three separate times, it would count as three visits.
- Signed up participants: the total number of users who have signed up and registered to participate fully in your event. Note: If your event is public, attendees need only sign up if they want to comment on presentations or access private live sessions.
- Unique presentation views: the total number of unique views of presentations by participants. If the same individual navigates to the same presentation page three times, it would only count as one unique view.
- Time (hours) spent by participants engaging: the cumulative time spent by participants engaging with content and interacting with others.
- Cumulative posted comments (graph): a running total of comments posted over time.
- Cumulative user sign ups (graph): a running total of users who have signed up and successfully registered for your event over time.
- User/visitor sessions (graph): the number of individuals (public viewers or registered participants, depending on your access settings) who visited your event at any given point in time.
- Number of asynchronous presentations: the total number of presentations that were submitted by presenters for your event.
- Number of presenters: the total number of presenters (and co-presenters listed on the submission) who submitted one or more presentations.
- Live sessions organized: the total number of live sessions scheduled by the organizer on the Live Sessions page. This does not include any Tables that were set up.
- Number of comments: the total number of comments posted by event participants across all the presentations that are part of your event.
- Presenters by level/classification (graph): the representation of presenters across their self-identified level/classification. This data is directly tied to the “Level/Classification” field that is part of the default submission form; if the field answer options were modified then this graph may represent other results. If the field was removed from the submission form, no results will be displayed.
- Presenters by major/department (graph): the representation of presenters across their self-identified major/department. This data is directly tied to the “Major/Department” field that is part of the default submission form; if the field answer options were modified then this graph may represent other results. If the field was removed from the submission form, no results will be displayed.
- Presentations by subject (graph): the representation of presentations across self-identified subject areas. This data is directly tied to the “Subject” field that is part of the default submission form; if the field answer options were modified then this graph may represent other results. If the field was removed from the submission form, no results will be displayed.